This is Your Galaxy: New Data Help Astronomers Explore the Hidden Milky Way

(Originally published by University of Tokyo)
August 8, 2013
The Sloan Digital Sky Survey III (SDSS-III), which several members of Kavli IPMU has been a part of, released a new online public data set featuring 60,000 stars that are helping to tell the story of how our Milky Way galaxy formed.
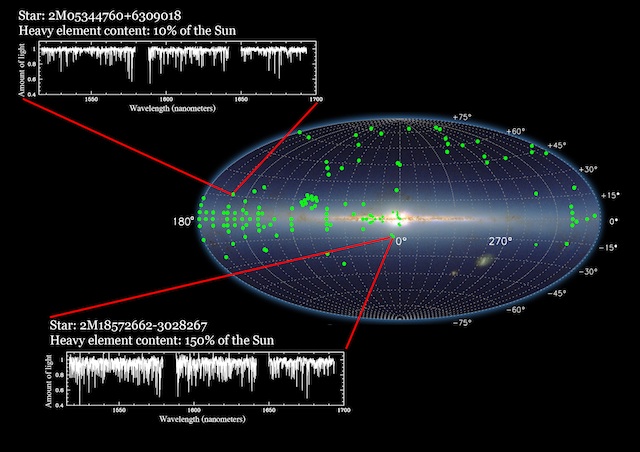
The highlight of today's "Data Release 10" is a new set of high-resolution stellar spectra -- measurements of the amount of light given off by a star at each wavelength -- using infrared light, invisible to human eyes but able to penetrate the veil of dust that obscures the center of the Galaxy.
"This is the most comprehensive collection of infrared stellar spectra ever made," said Steven Majewski of the University of Virginia, the lead scientist for the APOGEE project. "These sixty thousand stars are selected from all the different parts of our galaxy, from the nearly-empty outskirts to the dust-enshrouded center. Our spectra are allowing us to peel back the curtain on the hidden Milky Way."
The new spectra are the first data released by the SDSS-III's Apache Point Observatory Galactic Evolution Experiment (APOGEE), an effort to create a comprehensive census of our Milky Way galaxy.
"A star's spectrum is a powerful tool for learning about the star -- it tells us key details about the star's temperature and size, and what elements are in its atmosphere," said Jon Holtzman of New Mexico State University, who led the effort to prepare the APOGEE data for Data Release 10. "It's one of the best tools we have for learning about stars, like getting a photo of someone instead of just knowing their height and weight."
The question of how our Milky Way galaxy formed has been the subject of scientific speculation and debate for hundreds of years. APOGEE's three-dimensional map will provide key information for resolving central questions about how our galaxy formed over the many billions of years of its history.
The Milky Way currently has three main parts: a high-density oblong bulge in the center, the flat disk where we live, and a low-density spherical component called the "halo" extending out hundreds of thousands of light years. "Stars in these different regions have different ages and compositions, which means they formed at different times and under different conditions throughout the history of our galaxy," says Gail Zasowski, an NSF Postdoctoral Fellow at The Ohio State University who led the critical effort to maximize APOGEE's scientific potential by selecting the best possible sample of stars.
If you look up at the sky from a dark site, far away from the overwhelming glow of city lights, the Milky Way galaxy appears as a luminous band across the sky, overlaid with dark curtains. This band is the disk and bulge of our galaxy, and the curtains are the dust that blocks visible light from more distant parts of the Milky Way.
Because of this dust, previous studies of stars in the Milky Way have been limited in their ability to consistently measure stars toward the center of our galaxy. APOGEE's solution is to look in infrared light, which can pass through the dust. This ability to explore previously hidden regions of the Galaxy allows APOGEE to conduct the first comprehensive study of the Milky Way, from center to halo.
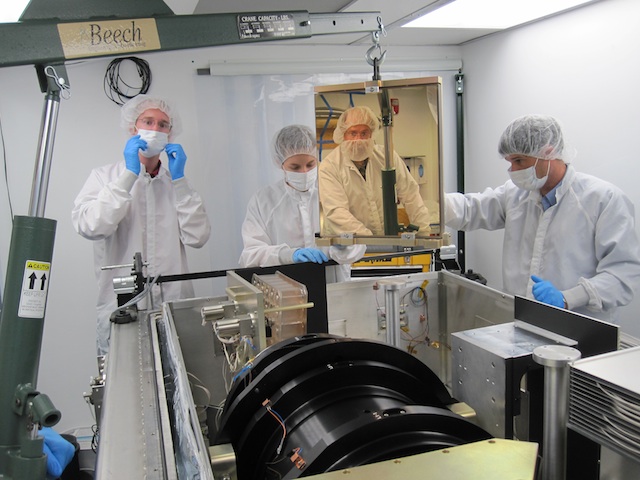
Observing tens of thousands of stars is a time-consuming task. To accomplish its goal of observing 100,000 stars in just three years, the APOGEE instrument observes up to 300 different stars at a time using fiber-optic cables plugged into a large aluminum plate with holes drilled to line up with each star. Light passes through each fiber into the APOGEE spectrograph, where a prism-like grating distributes the light by wavelength. "The grating is the first and largest of its kind deployed in an astronomy instrument," said John Wilson of the University of Virginia, who led APOGEE's instrument design team. "That technology is critical to APOGEE's success."
APOGEE's spectra of stars will help unlock the history of our galaxy, and the key is learning the compositions and motions of stars in each region. Because elements heavier than hydrogen and helium were produced in stars and spread through the Galaxy by stellar explosions and stellar winds, astronomers know that stars with more of these heavy elements must have formed more recently, after previous generations of stars had time to create those heavy elements.
"By finding which parts of the Galaxy contain older versus newer stars, and by putting this together with how the stars are moving, we can write a detailed history of how the Galaxy formed, and how it evolved into what we see today," said Peter Frinchaboy of Texas Christian University, who coordinated all of the APOGEE observations.
APOGEE data also provide a rich context for investigating a wide range of questions about the stars themselves. Because APOGEE observes each target star several times, it can identify changes in each star's spectrum over time. This feature has enabled the APOGEE team to discover unusual types of rapidly variable stars, to pinpoint how many stars are actually binary stars with unseen companions, and even to detect the subtle stellar motions caused by orbiting exoplanets.
Data Release 10 also publishes another 685,000 spectra from the SDSS-III Baryon Oscillation Spectroscopic Survey (BOSS). These new spectra come from galaxies and quasars as seen when our universe was much younger, just as the mysterious force of "dark energy" was beginning to influence the universe's expansion. The new BOSS spectra, and the additional spectra that the SDSS-III will continue to obtain in the final years of the survey, will help scientists in their quest to understand what dark energy might be.
"The release of DR10 represents a major new contribution from the SDSS collaboration to our understanding of the cosmos," said Kevin Bundy of Kavli IPMU, who leads a SDSS's future project Mapping Nearby Galaxies at APO (MaNGA), "The new APOGEE data featured in the release is the beginning of a completely new view of our Milky Way Galaxy and I'm sure many exciting discoveries will follow. Turning this new page in SDSS-III sets the stage for SDSS-IV which begins next year with a continuation of APOGEE and the beginning of a new SDSS survey called MaNGA that I am leading here at Kavli IPMU. Much as APOGEE is mapping our galaxy, MaNGA will map the interiors of 10,000 nearby galaxies, offering new insight on their formation and evolution."
"The successful campaign by APOGEE will pave the way to the exciting future of this field," said Director of Kavli IPMU Hitoshi Murayama, "In addition to MaNGA, we at Kavli IPMU are also developing a multi-object spectrograph called Prime Focus Spectrograph (PFS) for the Subaru Telescope. Combined with the data from GAIA satellite that will be launched this year, we hope to understand the assembly history of Milky Way and dark matter profiles in the Local Group. It is getting very exciting!"
SDSS-III is a six-year survey of nearby stars, the Milky Way galaxy, and the distant cosmos. The Sloan Foundation 2.5-meter telescope at Apache Point Observatory in New Mexico conducts observations every night that feed either the BOSS optical or APOGEE infrared spectrographs. "We've been putting out data releases since 2001, and we're not slowing down yet," said SDSS-III Spokesperson Michael Wood-Vasey of the University of Pittsburgh. "Public access to data has always been a key goal of our project, and we're proud to continue that tradition today with this new release rich with information about our own galaxy." All of these data are available, to researchers and the public alike, at http://www.sdss3.org/dr10.
ABOUT THE SLOAN DIGITAL SKY SURVEY
Funding for SDSS-III has been provided by the Alfred P. Sloan Foundation, the Participating Institutions, the National Science Foundation, and the U.S. Department of Energy Office of Science. The SDSS-III web site is http://www.sdss3.org .
SDSS-III is managed by the Astrophysical Research Consortium for the Participating Institutions of the SDSS-III Collaboration including the University of Arizona, the Brazilian Participation Group, Brookhaven National Laboratory, Carnegie Mellon University, University of Florida, the French Participation Group, the German Participation Group, Harvard University, the Instituto de Astrofisica de Canarias, the Michigan State/Notre Dame/JINA Participation Group, Johns Hopkins University, Lawrence Berkeley National Laboratory, Max Planck Institute for Astrophysics, Max Planck Institute for Extraterrestrial Physics, New Mexico State University, New York University, Ohio State University, Pennsylvania State University, University of Portsmouth, Princeton University, the Spanish Participation Group, University of Tokyo, University of Utah, Vanderbilt University, University of Virginia, University of Washington, and Yale University.